
Currently, in progress, OS was made on Ubuntu(Windows bash) + VIM.
Until now, I can handle it, but I felt limitation so I think I need debugging tools.
QEMU itself has some debugging tools but it is weak than professional tools.
Before, We can check the value in the memory using qemu’s function.
You can use that function to press ALT + 2 to enter the QEMU console and you can check the value using command-line x [address]
I think maybe I can make 64bit kernel much faster if I use a debugger.
Well, Qemu has a function of gdb hosting itself.
If you want to use that, type the initial qemu options:
-gdb tcp::[prot]
And a GDB side, launch gdb,
(gdb) target remote tcp::[port]
and you can successfully connect that.
For now, Debugging is available.
Like handling memory.
(gdb) break *0x200000
You can make a breakpoint on that address,
(gdb) continue
and you can enter the debugging console when it executes that address.
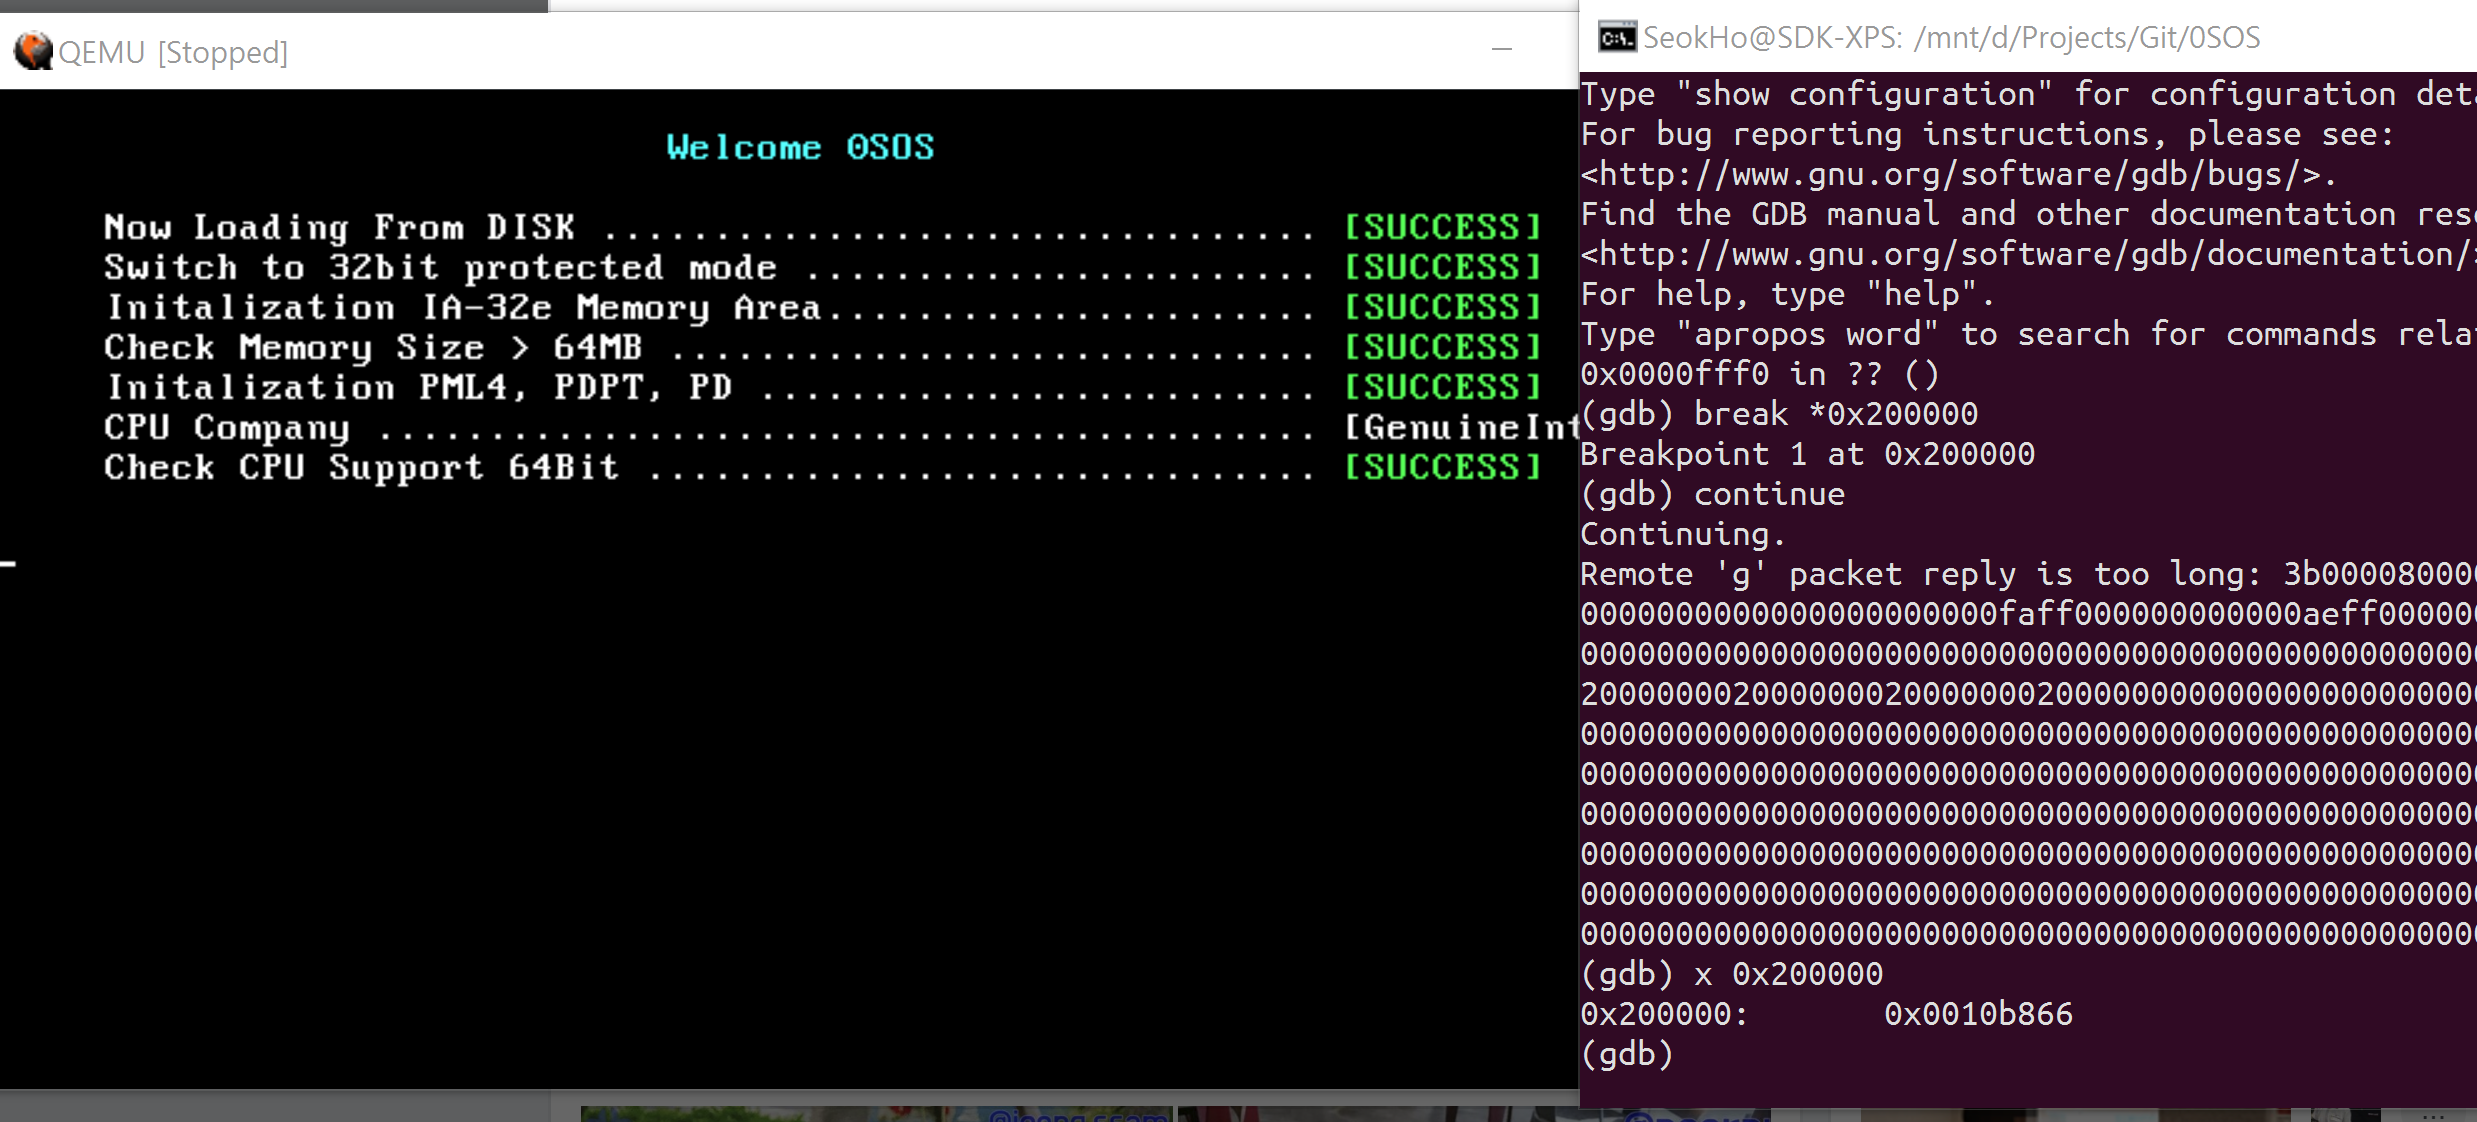
But it hasn’t symbol data so you cannot break on particular expression or function, so I felt that is a half.
And I cannot use many functions as a list.
For adding symbol, first, add a gcc option -g in makeifle, now the OS containing debugging information.
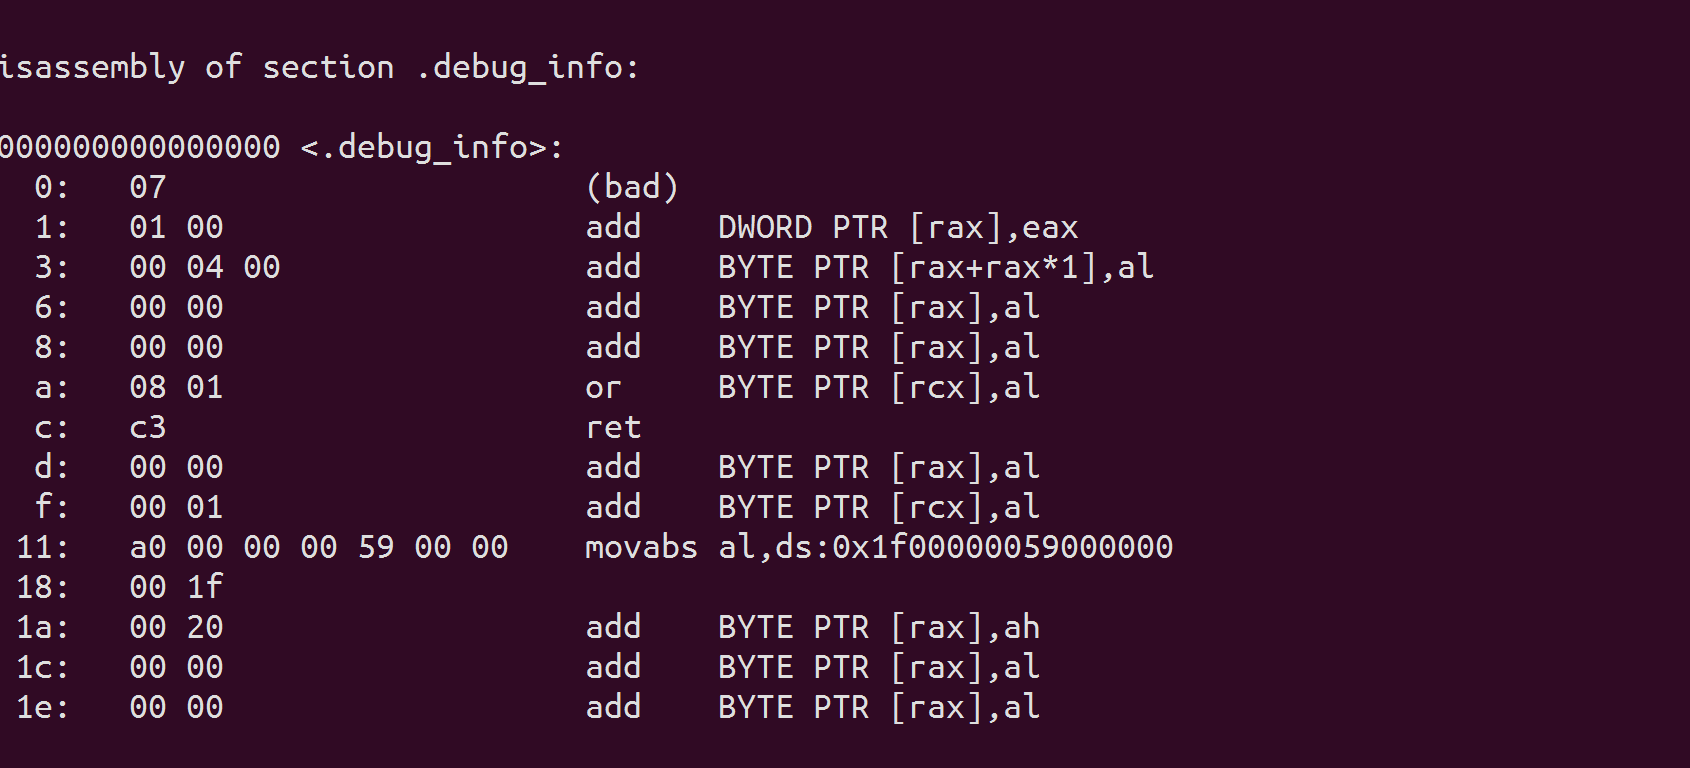
The picture above is the result of opening .elf file using objdump.
and when you launch gdb, you can connect with that.
gdb -s [location]
You can address the .elf file that completed linking.
For me, I thought I’ll develop 64-bit mode, So I appoint ‘02_Kernel64/Obj/Kernel64.elf’
Well,
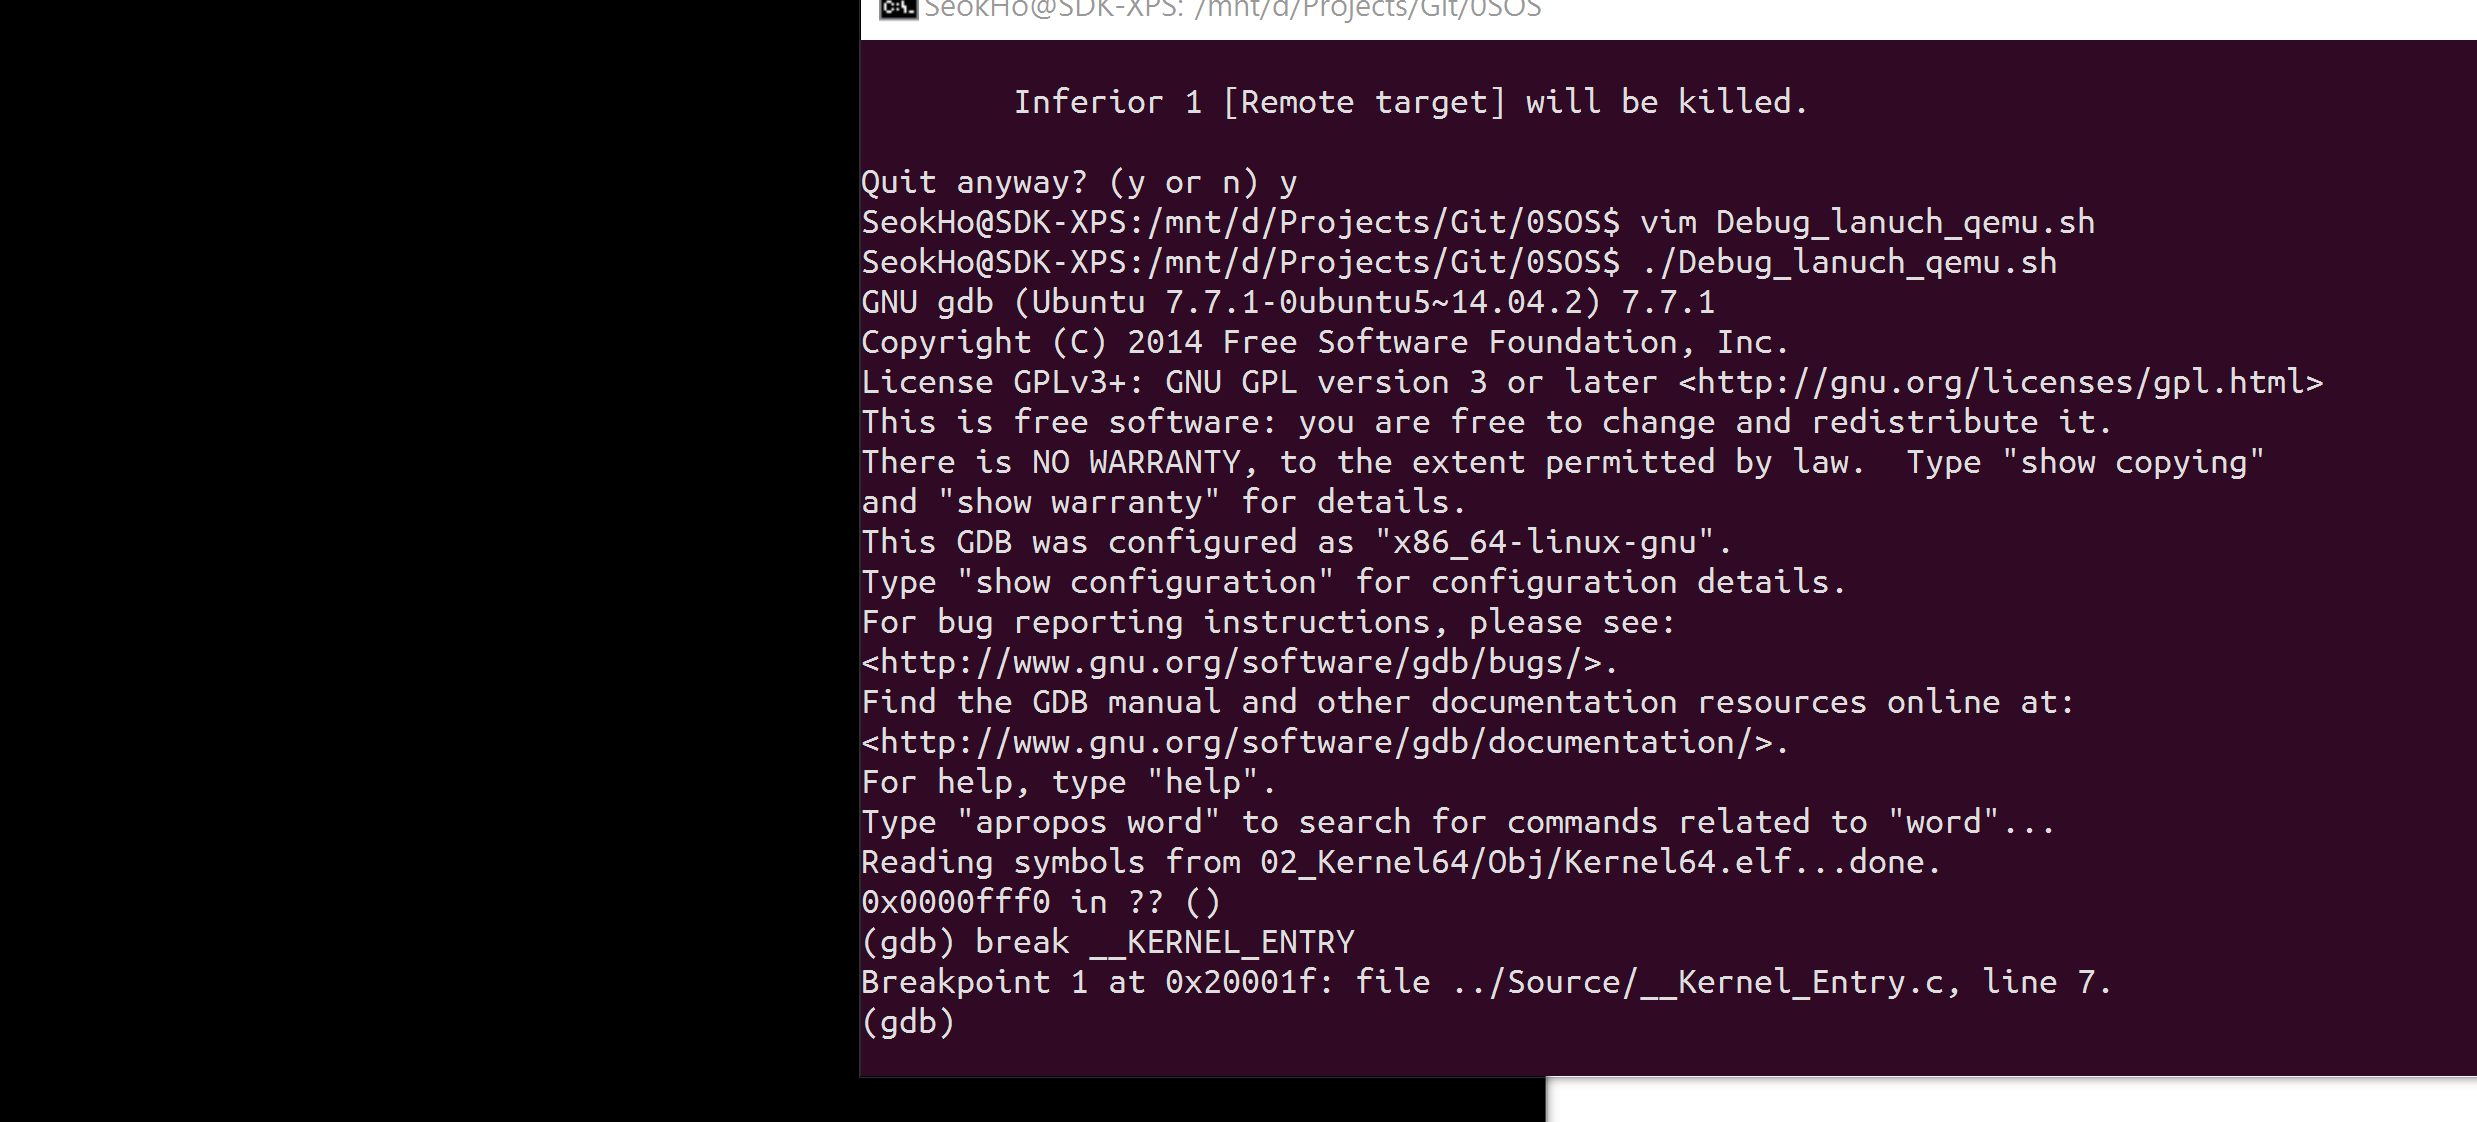
We can make a breaking point using the function name.
And progress the GDB using the command ‘continue’, and reach that point,
list
below image is the result of command the ‘list’
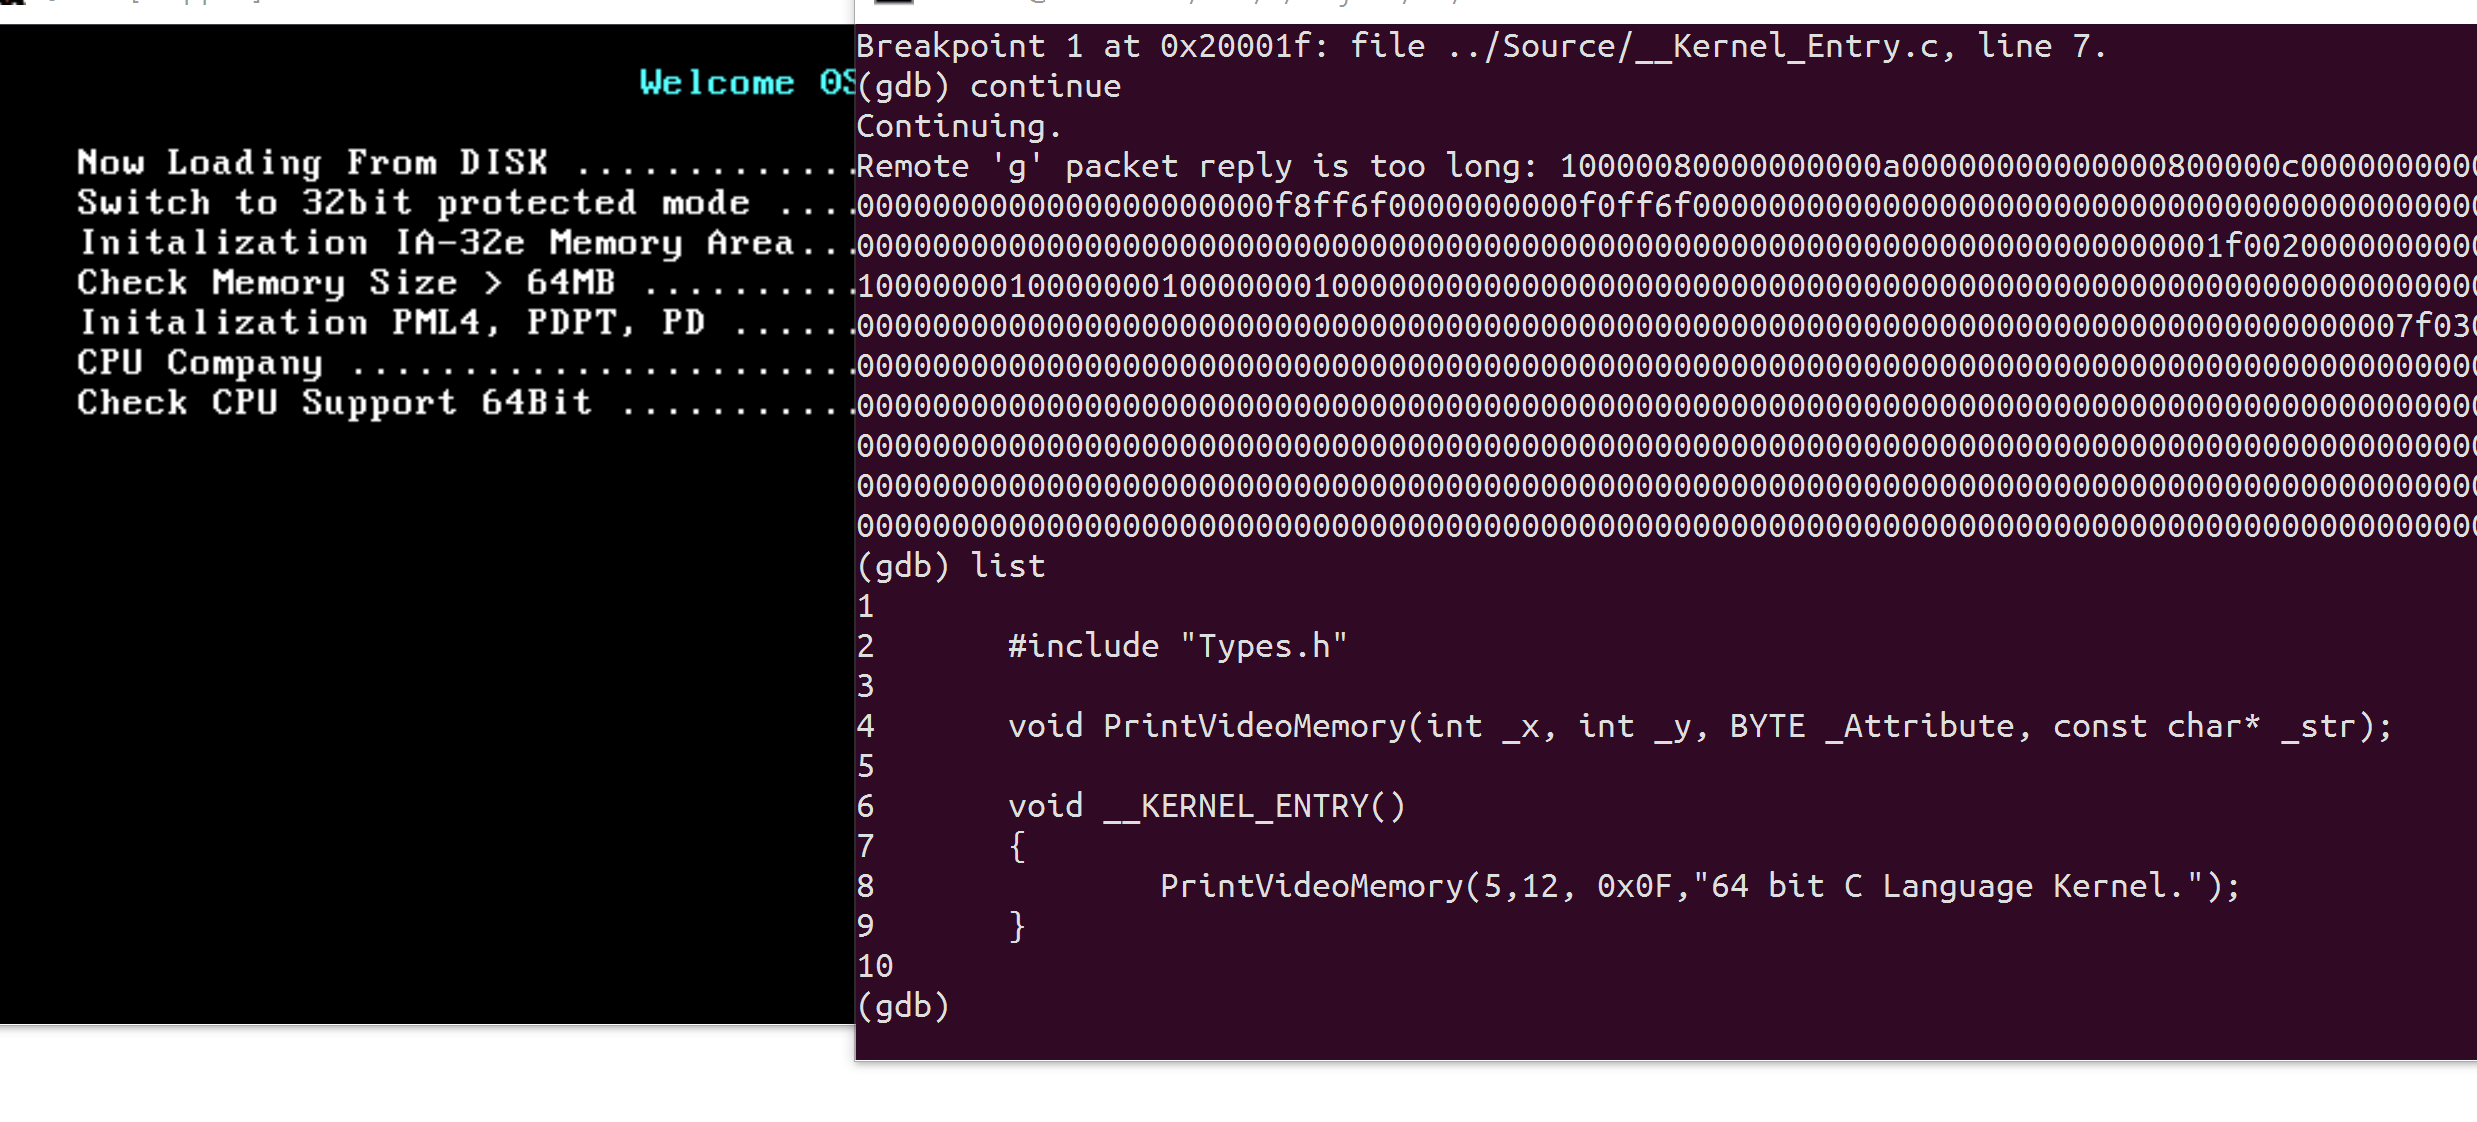
Now I made a debugging environment.
I’m worried about the first time of GDB using as well.
If you try to use the connection between gdb and qemu, I hope this article will help.